03.02.2026 | Jochen Bettzieche | SLF News
After the avalanche winter of 1950/51, SLF researchers developed a system for mapping areas at risk from avalanches. The resulting colour scale for danger zones still forms the basis of the hazard maps produced today.
- The avalanche winter of 1950/51: Dubbed the 'Winter of Terror', this disastrous season prompted the launch of Switzerland's first avalanche hazard maps.
- Building safely in avalanche areas: Hazard zones coloured from red to white determine where construction is and is not permitted.
- Avalanche risk and climate change: Changing snow conditions require regular adjustments to hazard zones.
With around 1,500 buildings, railway lines and power lines destroyed, the winter of 1950/51 saw well over a thousand damaging avalanches in Switzerland alone, causing financial losses running into hundreds of millions of Swiss francs (adjusted for inflation). In mountainous areas, the avalanches mainly hit relatively new residential buildings, stables and commercial premises. "Many of the buildings destroyed were only 10 or 20 years old," says Stefan Margreth, head of the Avalanche Protection Measures research group at the WSL Institute for Snow and Avalanche Research (SLF).
This was not because they were poorly built; many were simply in the wrong place. Settlement areas had expanded rapidly in the decades prior to the winter of 1950/51, often without regard for avalanche danger. "Well into the 20th century, people relied on experience and knowledge passed down from generation to generation," explains Margreth. Newcomers, though, often ignored the warnings of locals and built in avalanche terrain. But that was about to change. In June 1952, the Federal Department of Home Affairs demanded the creation of avalanche registers and avalanche hazard maps.
Guidelines three decades in the making 
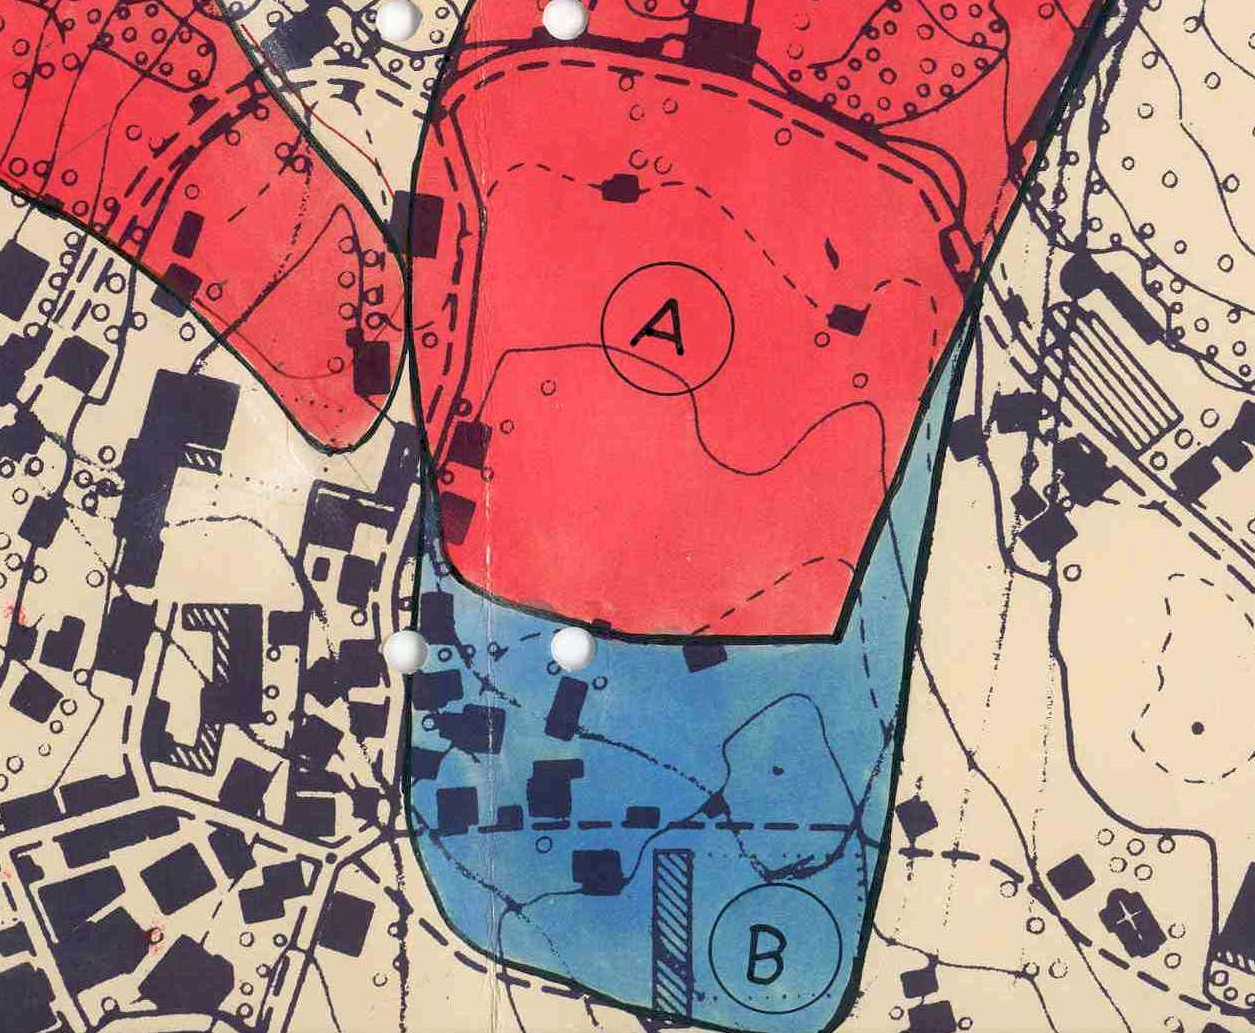
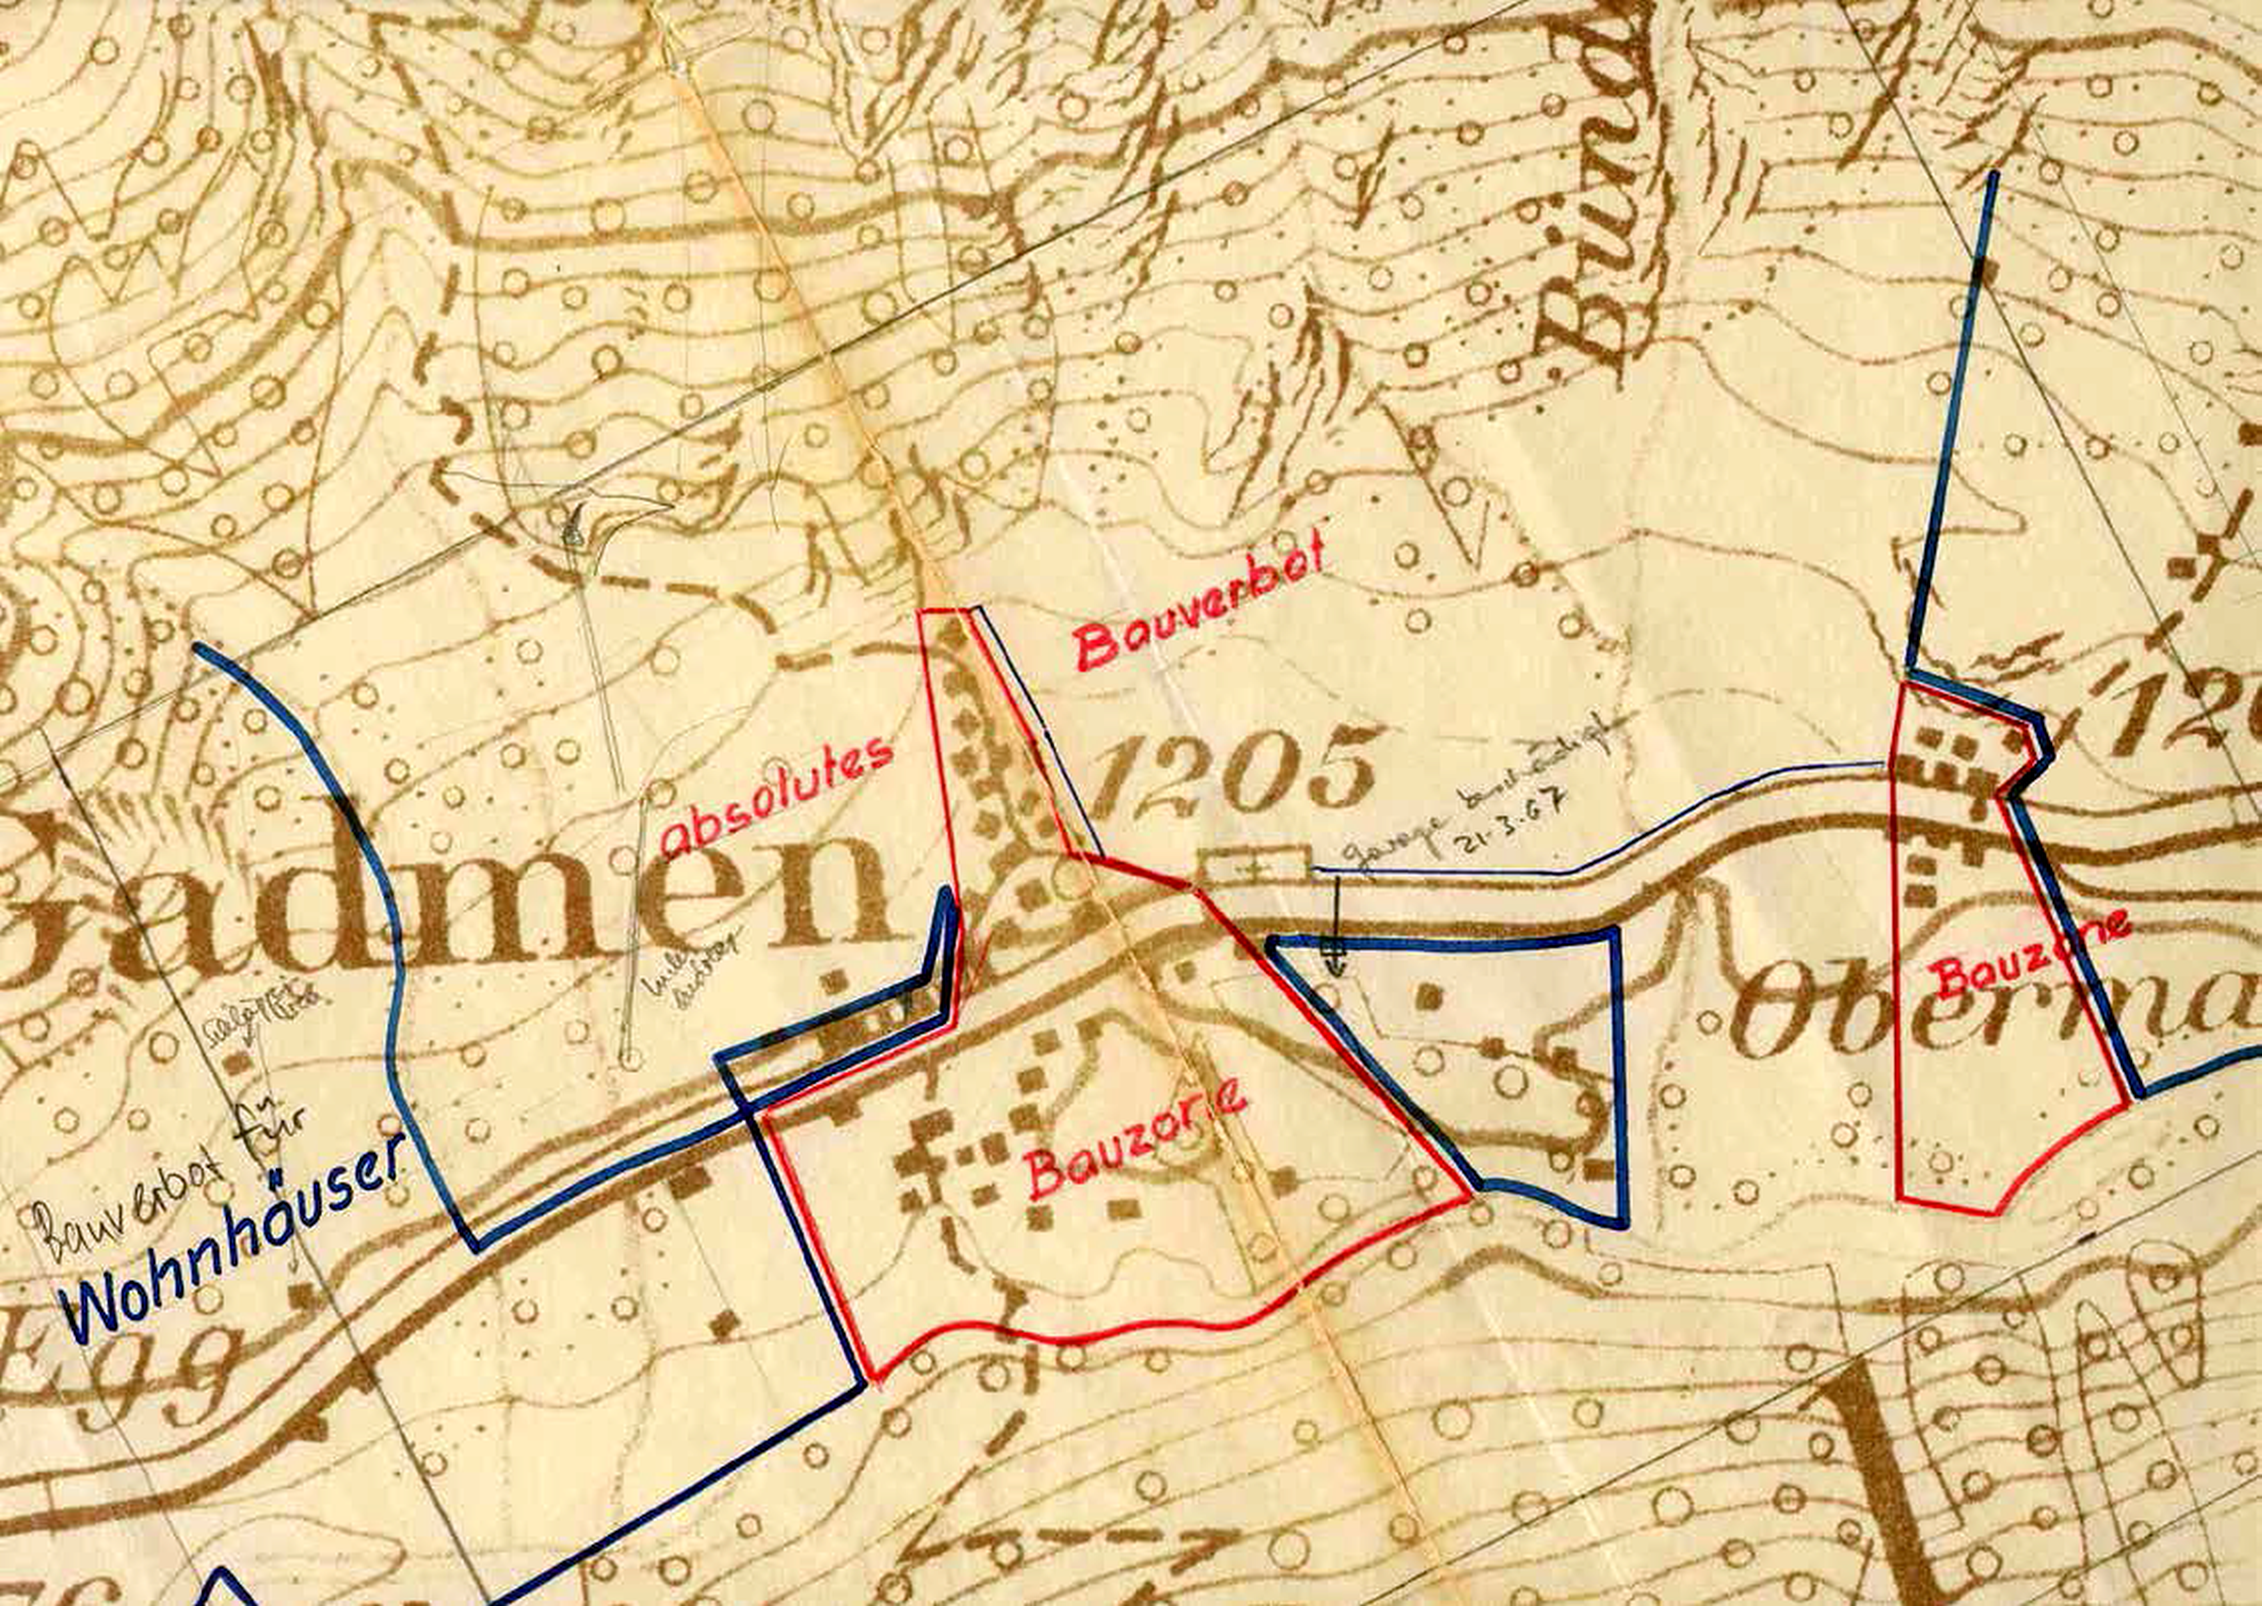
Just two years later, in 1954, Switzerland's first avalanche hazard map was created for the municipality of Gadmen in the Bernese Oberland. In 1960, the SLF produced the first map featuring red and blue zones for the municipality of Wengen: no building at all is permitted in red zones, while in blue zones building is permitted subject to certain conditions. "Hazard maps are now available for virtually all settlements in Switzerland," says Margreth. However, getting to this point was a long journey that took several decades.
SLF employees played a key role in developing a uniform standard for hazard maps. Experts investigated which types of avalanches could occur at which locations and with what severity. They divided the permissible pressure exerted by avalanches on structures into several levels. They also analysed how often a particular location was hit by avalanches, whether every 30 years or less, only every 30 to 100 years, or every 100 to 300 years. In this context, it is important to correctly assess the probability of death or injury/damage, given that many people tend to underestimate hazards that occur only rarely, for example once every 300 years. In the latter case, if a building stands for 50 years, the probability of a damaging avalanche occurring there during that period is 17%. "What's more, an event that only occurs once every 100 years as a long-term average could still happen in two consecutive winters," notes Margreth.
One of the key inputs for formulating the danger level criteria was records from past centuries on the scale and destructiveness of large avalanches. Other factors included topographical features along the avalanche path. In the 1970s, the first avalanche dynamics models also emerged. These were applied using a pocket calculator. Since then, researchers at the SLF have continuously refined and improved these models, which nowadays run on powerful modern computers. It took more than three decades to arrive at a uniform approach. "The guidelines on taking avalanche hazard into account in activities with a spatial impact, which are still in use today, weren't published until 1984," says Margreth.
Colour code for avalanches 
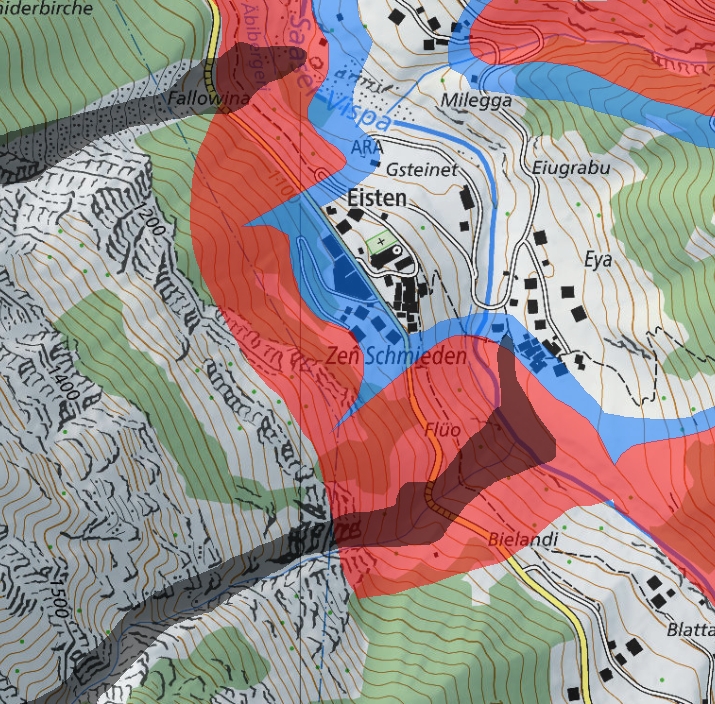
Avalanche hazard maps generally distinguish between five colour-coded zones. Red indicates considerable danger, and no construction is permitted here. In these areas, avalanches pose a threat to human life inside buildings and could destroy infrastructure. The construction of new buildings, and extension of existing ones, is prohibited. Destroyed buildings may only be rebuilt in exceptional cases and with protective measures in place. The fact that residential buildings are sometimes located in such red zones is due to historical reasons, explains Margreth. "These buildings often existed long before the creation of hazard maps."
At the second level, colour-coded blue, people inside buildings are mostly safe, provided that these buildings are reinforced. In blue hazard areas, snow impacts reach pressures of up to three tonnes per square metre. "To prevent damage, buildings are constructed to be extremely sturdy. This means that walls facing avalanches are made of concrete, for example, with no openings such as doors or windows." In some cases, local authorities may choose not to designate building zones in blue areas.
Even in yellow zones, where people outdoors are only at low risk, restrictions may be appropriate for sensitive sites. For all three zones, local authorities must produce intervention maps indicating how they will cordon off and evacuate the endangered area in an emergency. The emergency services also prepare for such incidents. White/yellow zones are relatively safe and represent the residual risk; the probability of an avalanche occurring that could endanger people and infrastructure is very low. "If you want to be on the safe side, live in a white zone," says Margreth.
The avalanche winter of 1950/51 – a state of emergency in Switzerland
Well-above-average precipitation in November, January and February led to disaster. In mid-January alone, it snowed non-stop for 88 hours. New fallen snow accumulated to depths only seen around every 50 to 100 years (up to 250 cm). The facts:
- Two tragic climaxes in January and February
- Well over 1,000 damaging avalanches reported
- 98 fatalities
- 234 people buried
- 235 head of livestock killed
- Around 1,500 buildings destroyed
- Worst-hit areas: Airolo (canton of Ticino), Andermatt (canton of Uri) and Vals (canton of Grisons)
- Financial losses running into hundreds of millions of Swiss francs (adjusted for inflation)
- 30,000 kg of supplies airdropped to cut-off communities (total flight time: 167 hours)
More details can be found in the first instalment of this four-part SLF series on the avalanche winter of 1950/51.
Established system, new challenge 
SLF researchers demonstrated how well the system works in their analysis following the avalanche winter of 2018, when the avalanche warning service issued the highest danger level – five, "very high" – for the first time this century. Using satellite images, the researchers evaluated avalanche activity in around half of the Swiss Alps, with a resolution of 1.5 square metres. They found that 18,000 avalanches had occurred across an area of 12,000 square kilometres. Analyses showed that not a single avalanche had extended beyond the danger limits in settlement areas, says Margreth. "Most of the very large and extremely large avalanches ended in the red zones, or sometimes the blue zones."
SLF staff recommend that hazard maps be reviewed regularly and updated if necessary. This is particularly relevant given the impact of climate change on avalanche activity. The danger posed by avalanches is expected to decrease, particularly at lower and medium altitudes, as less snow will fall there. At the same time, models predict a reduction in the number of avalanches involving dry snow but an increase in wet snow avalanches towards the end of the century. "This could alter the relevant zone boundaries," warns Margreth.
Starting next Monday, 9th February, read about how the avalanche winter of 1951 influenced research into protective forests.
SLF series: Avalanche winter of 1951 
- Part 1: How the disaster came about and what consequences it had
- Part 2: How SLF research helped to improve protective structures after the avalanche winter
- Part 3: How SLF researchers began to develop hazard maps and what these maps tell us
- Part 4: What insights the SLF gained on the subject of protective forests in the decades after 1951
Contact 
Copyright 
WSL and SLF provide image and sound material free of charge for use in the context of press contributions in connection with this media release. The transfer of this material to image, sound and/or video databases and the sale of the material by third parties are not permitted.