
Snow and climate change 
What would Switzerland's mountainous regions be like without snow? They are dependent on winter tourism, and snowpack is also important for the water industry. We deal with long-term snow measurement series and investigate the effects of climate change on snowpack.
Together with MeteoSwiss, we maintain a network of more than 100 observers who measure fresh snow and overall snow depths daily. The majority of these measurement series date back around 50 years, but some go back more than a century. These measurements and decades of data management today provide a valuable basis for resolving many practical questions, such as determining the snow reliability of a specific region or finding an ideal balance between the costs and benefits of preventive measures (avalanche barriers, temporary closures, snow load standards).
Snowpack is very sensitive to climate changes. When temperatures rise, the precipitation falls as rain, or the snow that is already on the ground melts away. This changes the extent, thickness and density of the snowpack. In order to quantify such changes and correctly classify individual winters with very little or large amounts of snow, long-term serial studies are very important.
Snowpack responds to climate change
Thanks to the long-term measurement data, we have been able to identify some clear trends. The last 30 years have seen very low levels of snow, particularly on the Swiss Plateau. The trend towards less snowy winters at most stations below 1300 m is statistically significant. The lower the altitude of the observation station, the more apparent the changes are. By contrast, above 2000 m the snow depths in midwinter (December to February) show no clear trend. The same is not true of snow cover duration: the vast majority of stations are seeing a clear reduction in the number of days with snow-covered ground, regardless of their altitude or location. The primary reason for this is earlier snow melt in the spring. The delay of snow onset in autumn is also a factor at lower-altitude stations. In addition, the annual maxima for snowfall and snow depths have tended to decline at all stations over recent decades.
Green Christmases increasingly common in the Alps
We also examine the future of snow, making forecasts based on a combination of climatic and snowpack modelling. We combine a variety of past weather data and climate warming scenarios to simulate the future snowpack in the Alpine region. If climate-damaging emissions are not reduced, the natural snowpack could shrink by up to 70% by the end of the century and the ski season could start half a month or even a month later than it does today. By the end of this century, snow cover lasting several days will be very rare on the Swiss Plateau, and only above 2500 m will there be enough natural snow for profitable ski resorts.
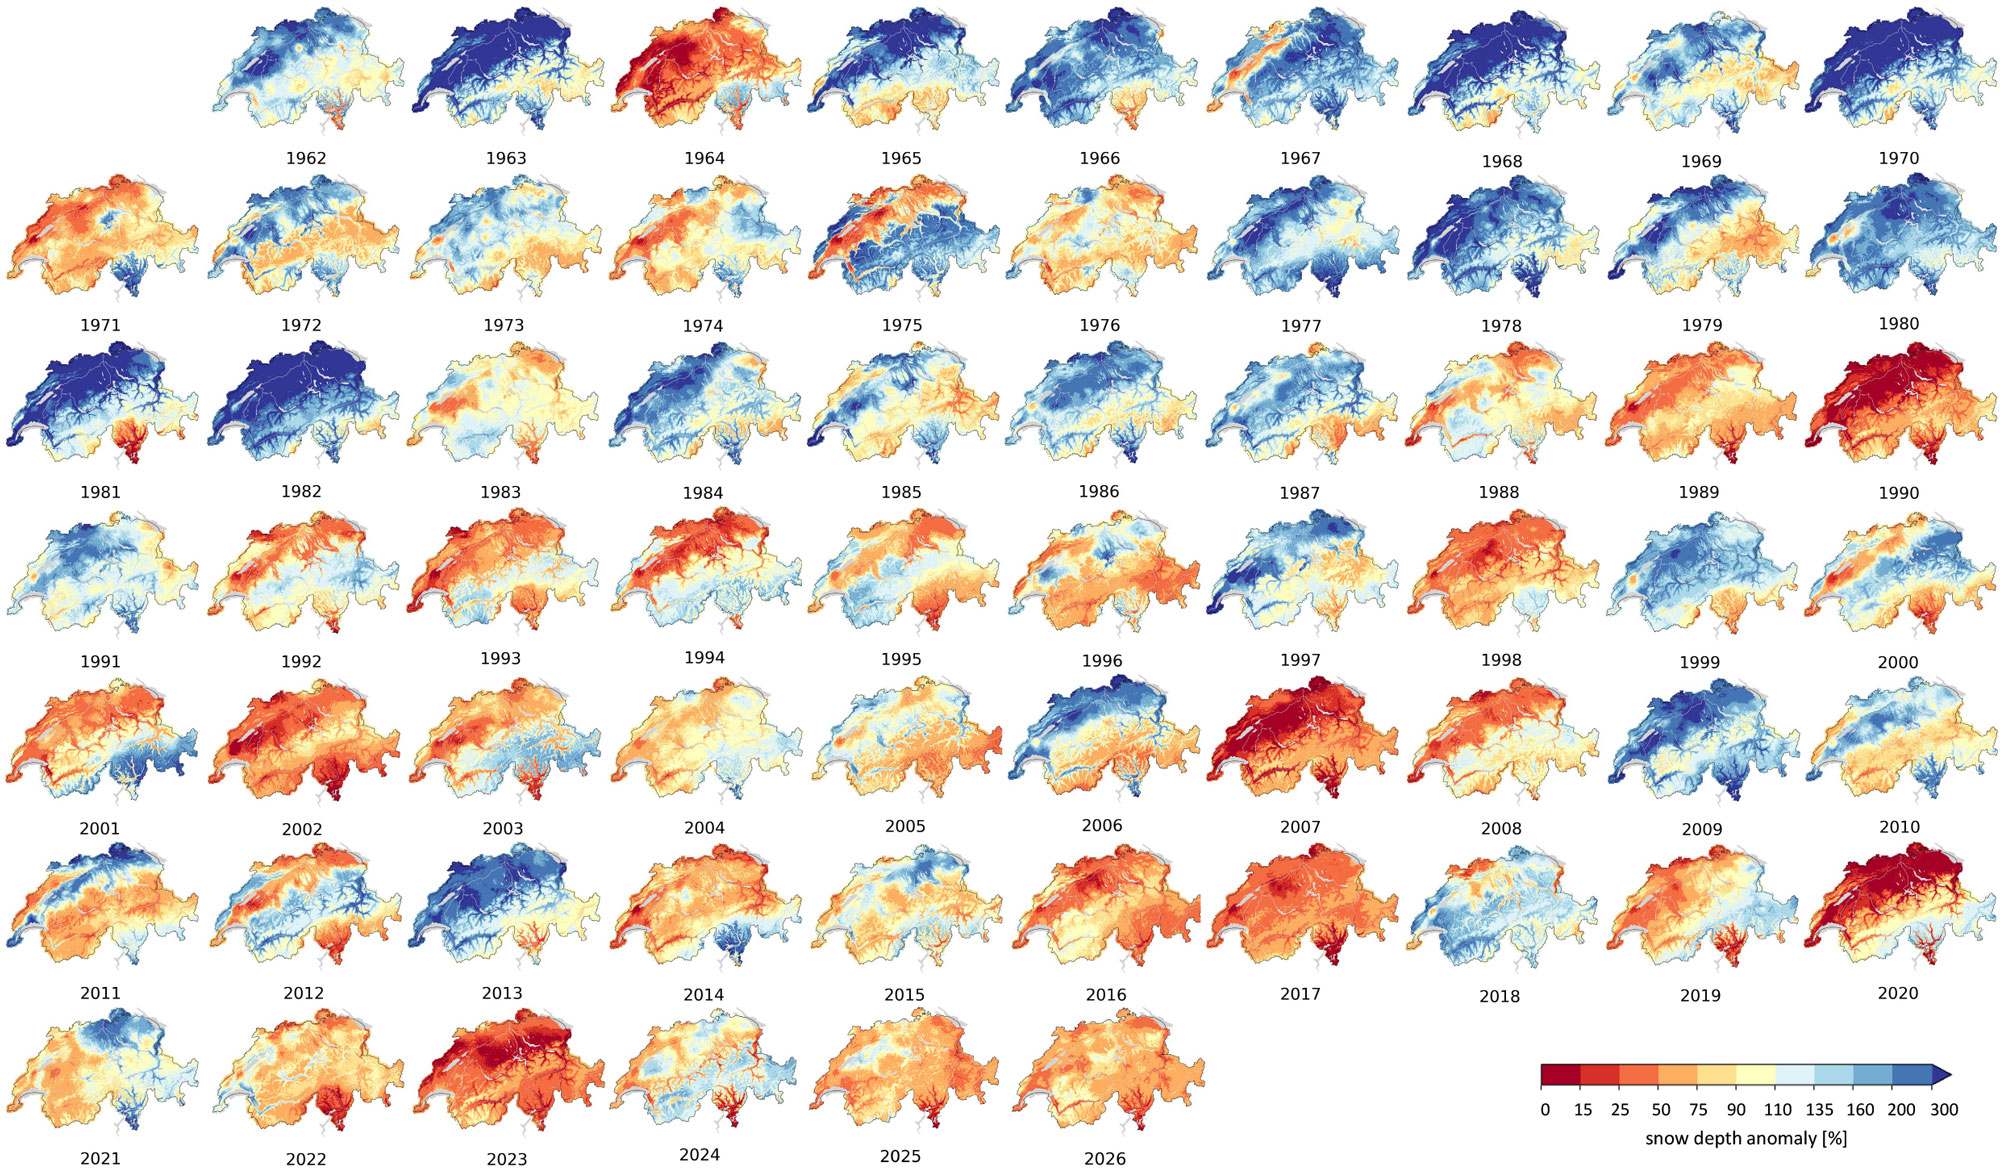
Snowcover in a Changing Climate 
The depth of snow on the ground is an important indicator for an Alpine country like Switzerland. In order to put the seasonal snow depth in in a climatological context, monthly and annual anomaly maps are regularly published in the annual winter reports. The temporal and spatial information on these maps is of high value to provide a quick overview where the mean snow depth for a certain month or hydrological year was higher, equal or lower than the long-term mean value. This information is an important basis to be able to describe the snow cover evolution for a specific time period.
Projects 
Snow Day index 
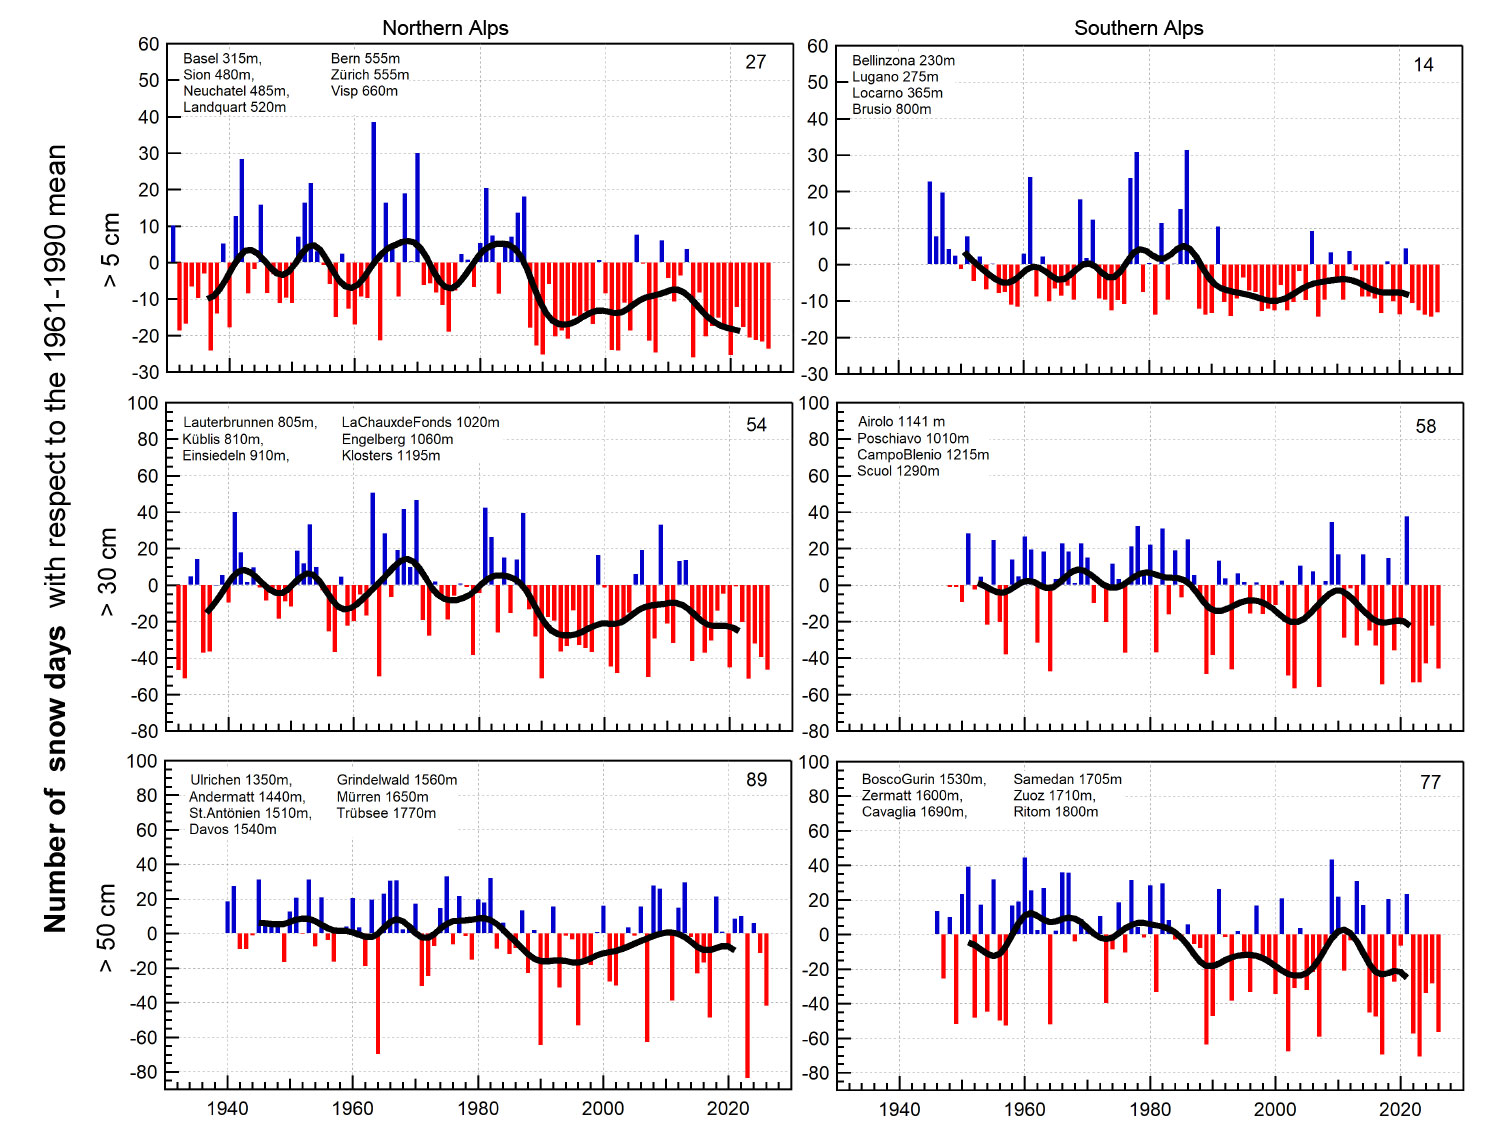
The Snowday index shows the annual snow day anomaly between December and March in Switzerland from its long-term mean separated for the northern and southern side of the Alps and 3 altitude zones. A snow day is defined as day with a snow depth larger a given threshold. The threshold was chosen depending on the practical usability for the typical activity in the the corresponding altitude zone:
Lowest zone 201-800 m asl: Building a snowman ≥ 5 cm
Middle zone 801-1300 m asl: Cross country skiing ≥ 30 cm
Highest zone 1301-1800 m asl: Downhill skiing ≥ 50 cm
The annual values in each graph show the deviation of the mean value of 4 to 7 SLF or MeteoSwiss snow measurement stations in this altitude zone from their long-term mean (1961-1990). The absolute value of this long-term mean is given in the upper right corner. The bold black line represents 10 year Gaussian filtered values. More details can be found in the following publication.