Information on snow measurement
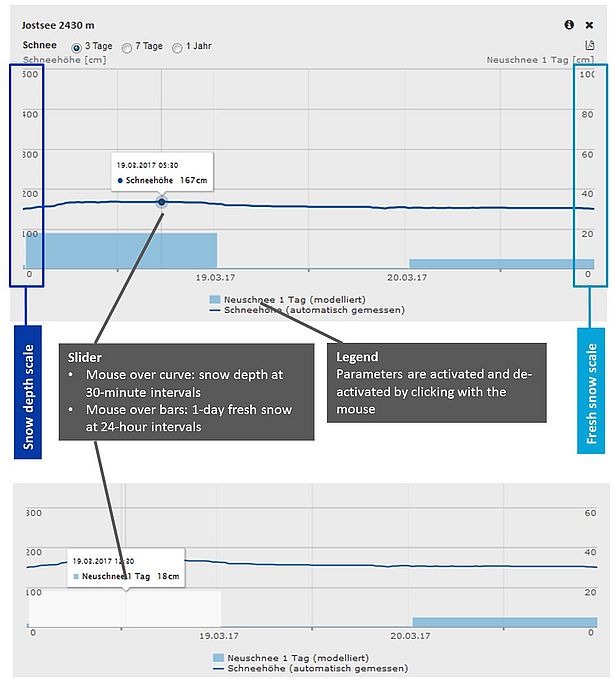
While the snow depth curve over time permits conclusions to be drawn about snowfall, settling and melting, fresh snow plays a crucial role in avalanche formation. The stated value is the depth of fresh snow – the amount of snow, measured vertically, that has fallen in a certain period (generally 24 hours).
Measurements are taken at flat sites that are protected from the wind. The amount of fresh snow is measured by the SLF observers and also calculated by the automated IMIS snow stations.
Manual measurements
Snow depth and fresh snow are measured once daily, if possible in the mornings between 7 and 7.30 am. The (overall) snow depth is measured by the gauge installed at the measuring site. The fresh snow is measured with a white snow board placed on the snowpack, flush with the snow surface. Between 7 and 7.30 am the next day, the amount of snow that fell during the previous 24 hours is measured by placing a yardstick on the board.
The values measured by hand are quite accurate. Most of the measuring sites are situated in intermediate altitude zones, between 1000 and 2000 m, however, so that if the fresh snow at the site is moist, or if rain is falling, the amounts of fresh snow lying at higher altitudes will be greater. In such cases it makes good sense to consult the values recorded by the automated IMIS stations at higher altitudes as well.
Calculations performed by IMIS snow stations
The data collected by the automated IMIS stations is updated every half-hour. To determine the snow depth, an ultrasound sensor mounted over the snowpack measures the distance to the snow surface.
The amount of fresh snow cannot be measured directly by the automated IMIS stations, but is calculated instead using the snowpack model SNOWPACK. Given that the snowpack is constantly settling, the amount of fresh snow does not simply equal the increase in snow depth, but is determined by adding from this figure the extent to which the old snow has settled. In the case of prolonged snowfall in particular, the snow can settle to the extent that the snow depth remains constant or even decreases, despite ongoing precipitation (example). In other words, the amount of fresh snow cannot be determined simply by consulting the snow depth measurements, and is therefore stated separately.
The variable normally used for the calculation is the amount of fresh snow that has fallen in the previous 24 hours. As a consequence of continuous settling, this value is smaller than the sum of the four constituent 6-hour values.
As with automatic measurements, errors can occur in modelling as well. Because the measured snow depths are also used to calculate the amount of fresh snow, errors made when recording these values can often give rise to inaccurate fresh-snow values. Errors can sometimes be detected if the time chart is consulted alongside the current value.
Typical errors include the following:
| Problem | Influence on measured data | |
|---|---|---|
Fresh or old snow transported by wind | Sharp upturn or downturn in snow depth curve. Even if this event actually occurred at the measuring station and was measured correctly, the indicated snow depth does not accurately reflect the conditions prevailing in the surrounding area. Drifting snow deposited at the measuring station can trigger the overstating of fresh snow quantities on the days that follow as well (because of inaccurate settling calculations). | |
Temperature dependence of snow depth measurement | On sunny days the snow-depth curve regularly dips marginally around midday. This response is caused by the temperature correction performed by the ultrasound sensor, which is too great because the temperature sensor is not cooled. | Example |
| Avalanches | Individual snow stations can be struck by avalanches. The snow-depth curve responds by rising abruptly. The measured snow depth does not accurately reflect the conditions prevailing in the surrounding area, and the modelled fresh-snow values are incorrect. | Example |
| Ultrasound sensor meauring error | Various defects can impair operation of the ultrasound sensor. An increase in snow depth can give rise to incorrect fresh snow values. | Example |
| Measuring of grass in the summer | Grass grows around numerous IMIS stations in the summer and is measured by the ultrasound sensor, which indicates an increase in ‘snow’ depth. If snow then falls, it compresses the grass and triggers a sudden decrease in the measured snow depth. | Example |
Information on temperature measurement (Sammelelement)
Information on temperature measurement
The air and snow surface temperatures are key factors when assessing the avalanche danger, in particular when springtime conditions with wet-snow avalanches prevail. The indicated temperatures are those recorded by the automated IMIS snow stations.
Snow surface temperature is calculated from the measured outgoing longwave radiation. It indicates, for example, whether a moist snowpack has refrozen, and is also a key variable used by the model SNOWPACK to calculate the snowpack. The maximum snow surface temperature is 0 °C (the melting point of ice). If a higher value is measured, either bare ground is exposed on at least a portion of the measuring site, or the sensor is faulty.
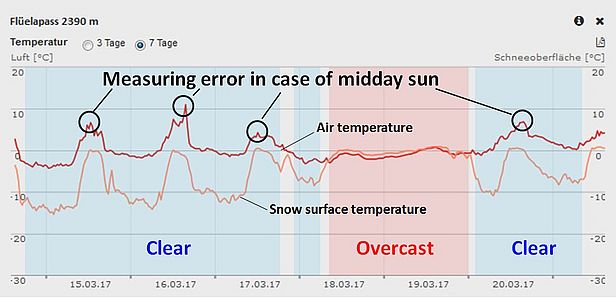
The air temperature is measured directly. The pattern traced by the air and snow temperature curves permits conclusions to be drawn about the extent of cloud cover. When the two curves trace a similar pattern, the weather is overcast; when they diverge and the surface temperature is lower than 0 °C, the skies are clear.

Problem: Sunshine
Air-temperature sensors cannot be ventilated because of the lack of energy. On fine days when there is no wind, the sun heats up the sensor housing. When this happens, the air temperature measured at around midday is too high. The air temperature is also measured at MeteoSwiss's SMN stations. These stations use cooled sensors, meaning that this problem does not occur there. However, there are only a few of these stations at high altitude.
Information on wind measurement
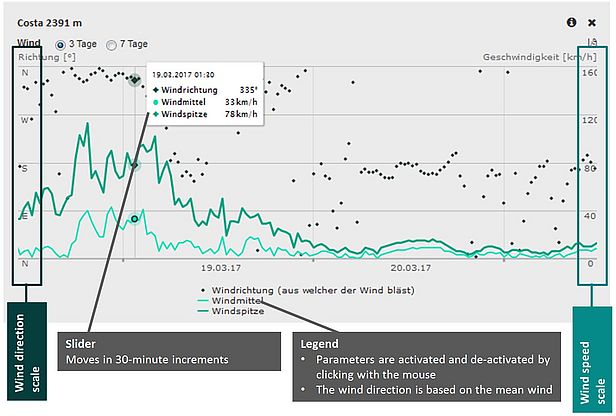
The wind can transport both fresh snow and loosely bonded old snow, and therefore exerts a major influence on the avalanche danger. Propellers installed at the automated IMIS stations measure both wind direction and wind speed. The indicated values are those recorded by the IMIS wind stations, which are located on exposed ridges at high altitudes.
| Mean: | vectorial mean over 30 minutes |
| Direction: | direction of vectorial means |
| Peak wind: | Maximum gust lasting 5 seconds recorded during the 30-minute measuring period. This variable is expressed as the wind velocity. The applied direction is the vectorial mean for the entire half-hour measuring period. |
Problem: Deposition of hoarfrost
Given the lack of an adequate power supply, the sensors installed at most stations are not heated. In the presence of supercooled water droplets and wind, the sensors can become coated with hoarfrost. If the meteorological parameters indicate the existence of such conditions, for a short time the measured wind values are not used. In some cases, the data captured by a sensor encrusted with hoarfrost can still be shown. In such instances, either the anemometer is not rotating and indicates a constant value for the duration of the hoarfrost, or it is rotating more slowly than the actual wind speed. The second of these two cases is very difficult to detect. The best option is to compare the values with those recorded by neighbouring stations or heated SwissMetNet (SMN) stations operated by MeteoSwiss. However, only a few such stations are located at high altitudes.
Timing of measurements
Current measured values
For each station and parameter, the most recent available value is used. The maps show only values that were measured no more than 90 minutes before the inquiry. Older measurements are disregarded and identified on the map by the symbol (x) ‘no value’.
8 am measurement (only fresh snow and snow depth, view with button at top right of map)
For the automated stations, the most recent available value measured between 6.30 and 8.15 am is shown. For the manual measurements, all the values recorded on the day concerned are shown. Most of these are recorded between 7 and 7.30 am. Missing values are indicated by an (x).
The previous day’s values are shown until around 7 am. They are replaced by the current values as these become available.
Time chart for snow depth and fresh snow
Time chart for snow depth and fresh snow
Snow depth and fresh snow values can be retrieved for the previous three days, previous week, or current hydrological year.

1-year graph
In addition to the values for the current year, the graph shows the maximum, average and minimum snow depth for each calendar day. The longer the measurements continue at a station, the more revealing the values.
The measurements made by the automated IMIS stations are neither verified nor corrected. Measuring errors, including in previous years, can therefore exert a strong influence on the maximum and minimum values in particular (A). The effect on the mean values is significantly less marked.

Time chart for air and surface temperature (Sammelelement)
Time chart for air and surface temperature
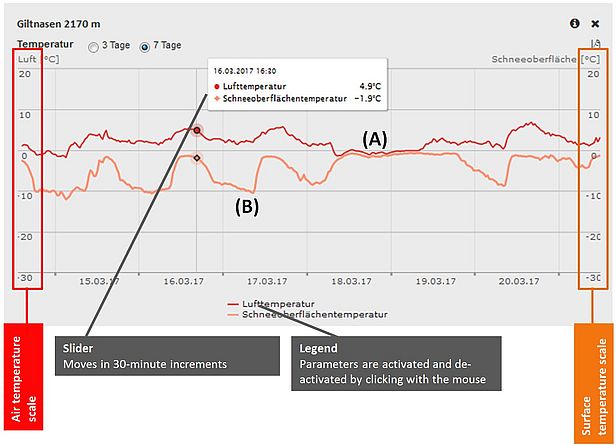
Air and surface temperature values can be retrieved for the previous three days or previous week.

The maximum snow surface temperature is 0 °C. If a higher value is measured, either bare ground is exposed on at least a portion of the measuring site, or the sensor is faulty. The pattern traced by the air and snow temperature curves permits conclusions to be drawn about the extent of cloud cover. When the two curves trace a similar pattern, the weather is overcast (A); when they diverge and the surface temperature is lower than 0 °C, the skies are clear (B).
Time chart for wind
Wind data can be retrieved for the previous three days or previous week.
