Avalanche hazard maps are an important instrument in spatial planning. They show where settlement areas are threatened by avalanches and how frequently and intensively the events can occur. They form the basis for the creation of hazard zones in land use planning and are important for emergency planning.
SLF employees drew up one of the first hazard maps in Switzerland for the municipality of Wengen back in 1960 - at that time still on the basis of observed avalanche events and without calculations. During the avalanche period of 1968, when the Davos region in particular suffered major damage and fatalities, a number of avalanches exceeded the existing danger zones. We published guidelines for the creation of hazard maps in 1984.
In the last two decades, avalanche simulations have become increasingly important for hazard zoning. The aim of avalanche simulations is, on the one hand, to quantify avalanche runout distances and, on the other hand, to determine the avalanche impact required for the planning of protective measures. We developed the avalanche simulation software RAMMS for this purpose. This represents the state of the art in avalanche calculation. After determining the starting conditions and other parameters, the model automatically calculates the spatial distribution of flow height, velocity and pressures. In Switzerland, the cantons are responsible for drawing up hazard maps. The hazard maps are drawn up by private engineering firms in collaboration with the cantonal natural hazards offices. The SLF can be consulted as a senior expert in the event of objections. The SLF also advises the cantons and private engineering firms on complex hazard situations.
In the avalanche winters of 1999 and 2018, the hazard maps generally proved their worth. Avalanches rarely travelled further than expected. After the avalanche winter of 1999, the avalanche paths in many avalanche areas were documented with aerial photographs. Thanks to this information, we were able to further develop our simulation models and the municipalities were able to improve their maps. Today, 99% of the municipalities with avalanche-prone areas have a hazard map. On behalf of the FOEN, the SLF, in collaboration with engineering offices and cantons, is revising the publication produced in 1984 on the creation of hazard maps.
Construction is prohibited in red hazard areas 
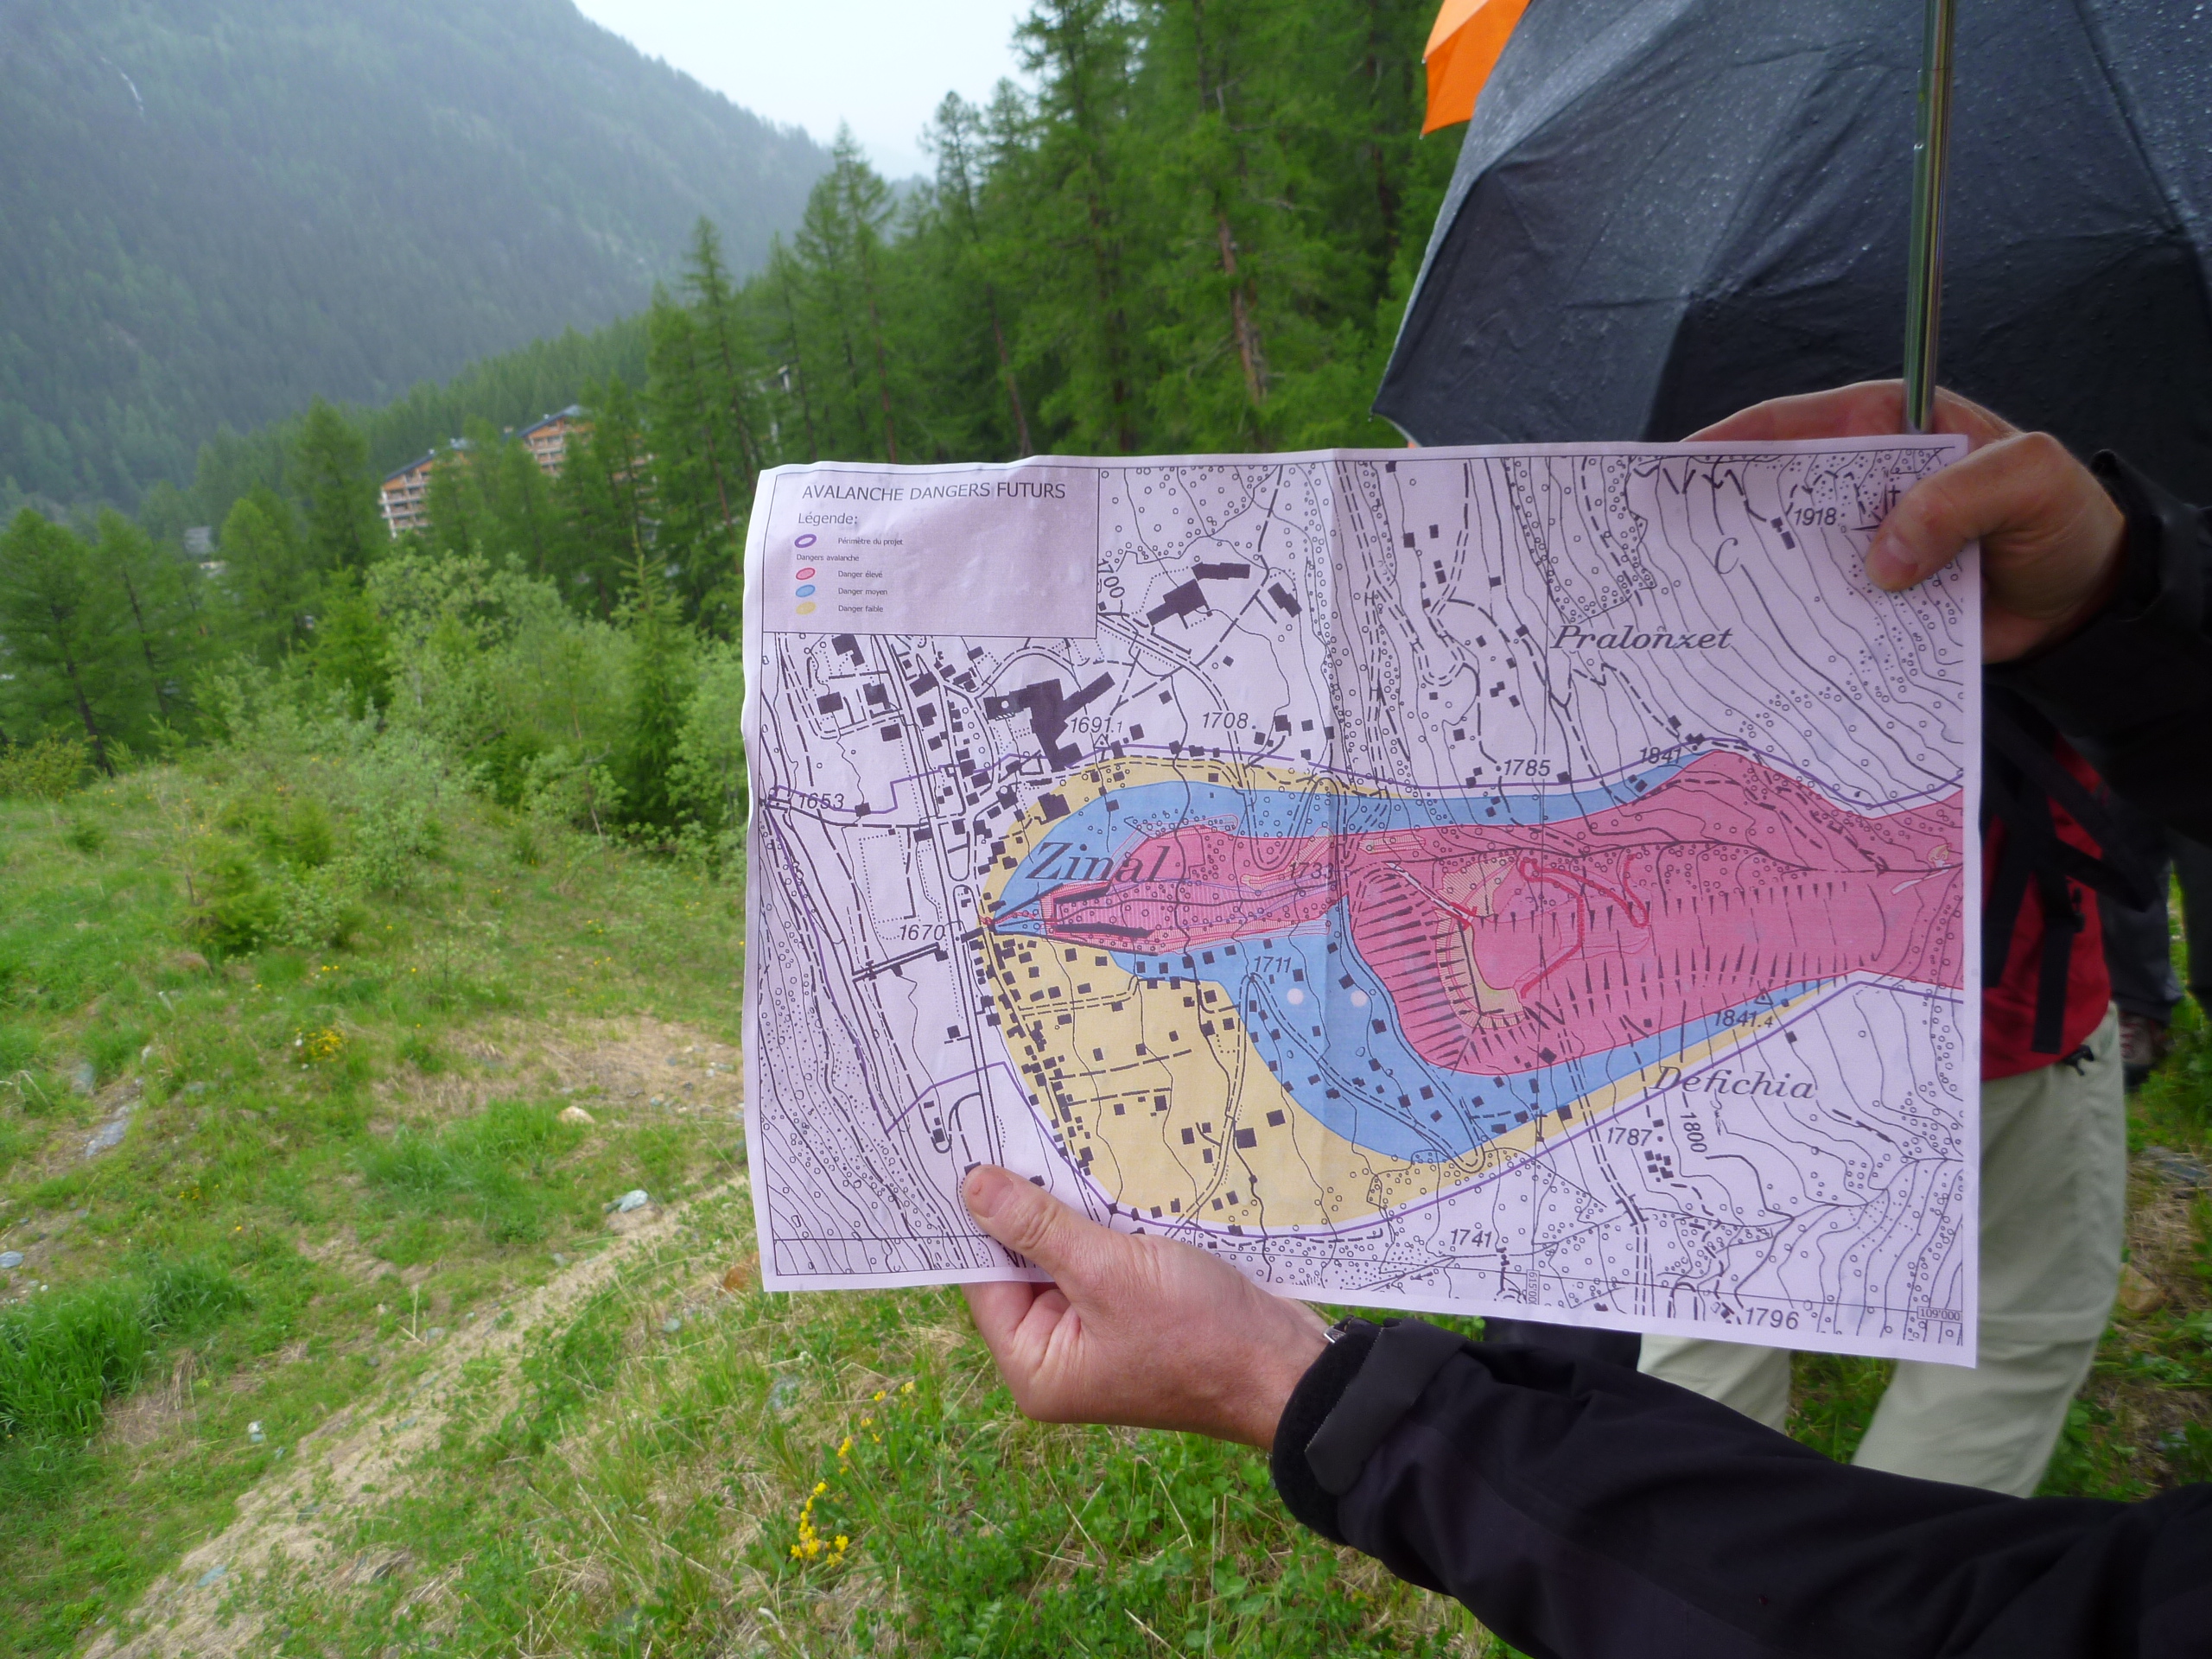
Hazard maps divide the terrain in detail into areas with different levels of danger. The frequency and intensity of the avalanche are the measure of the hazard. The different danger levels are shown in the colours red, blue, yellow and white.
"Red area" indicates an area at considerable risk. In the event of an avalanche, destruction of buildings must be expected. In the event of a 300-year avalanche, the pressures are more than 30 kN/m2. People are at risk both inside and outside buildings. No building zones may be designated in the red zone. The red zone is essentially a prohibited area.
In the "blue area", rare avalanches only occur with average pressures of less than 30 kN/m2. People are hardly at risk inside buildings, but outside them they are. New building zones may only be designated after a weighing up of interests. Building permits are subject to conditions. Exposed parts of buildings must be protected with structural measures (property protection), and evacuation plans for residents are also required.
There is a low risk in the "yellow area". People are hardly at risk and only minor damage to buildings is to be expected. Yellow areas are typically used in the run-out area of dust avalanches.
There is no or negligible danger in the "white area".
Limits of the hazard maps 
The problem is that many areas in the Alps were settled long before avalanche hazard maps were drawn up. Such areas can then only be secured with structural protection measures.